Tourism and pilgrimage demand curves describe how many people still book travel and stays in Israel as prices for flights, beds, or packages rise or fall. New readers meet these curves most clearly when holidays pack Jerusalem or quiet midweeks empty coastal inns. Foundation examines the israel mkt tourism pilgrimage demand explainer so everyday adults can read the same signals professionals watch without advanced training.
Plotting Arrival Numbers Against Room Rates in Holy Sites
Every extra shekel on a night near the Old City changes how many pilgrims and tourists decide to come. When rates climb, some cancel leisure trips yet keep sacred journeys because faith obligations feel non-negotiable. Operators therefore track occupancy against average daily rate to sketch the slope of the demand curve. Steep slopes mean small price cuts fill rooms fast; flatter slopes show visitors will pay more before walking away. Readers can watch published rate sheets from major chains during high festivals and compare them with empty-night discounts in ordinary weeks to see the curve take shape on the ground.
Airlines adjust seat inventories the same way. Higher fares during Passover or Christmas still sell because many travelers treat those dates as fixed. Lower fares in shoulder months attract price-sensitive leisure guests who might otherwise choose competing destinations. Together the room and seat numbers draw a simple picture: pilgrimage demand holds firm farther up the price axis while pure tourism demand softens sooner.
Distinguishing Pilgrim Commitment from Tourist Flexibility
Pilgrims often plan years ahead, book group packages, and accept higher costs to reach specific holy places on specific calendar days. Tourists compare Israel with Mediterranean alternatives and switch destinations when prices look steep. That difference produces two overlapping curves rather than one. Faith-based travel shows lower elasticity; leisure travel shows higher elasticity. Hotels that serve both groups carefully mix inventory so they never rely on only the flexible segment.
Group leaders from churches, synagogues, and mosques negotiate multi-year contracts that lock volumes even when spot rates rise. Independent tourists check last-minute apps and walk away if the total exceeds their mental budget. Managers therefore keep separate dashboards. One tracks contracted pilgrim nights; the other tracks open-market leisure nights. When both move in the same direction, overall demand is robust. When only leisure softens, the curve simply becomes steeper for that segment.
Seasonal Spikes That Define Israel's Hospitality Calendar
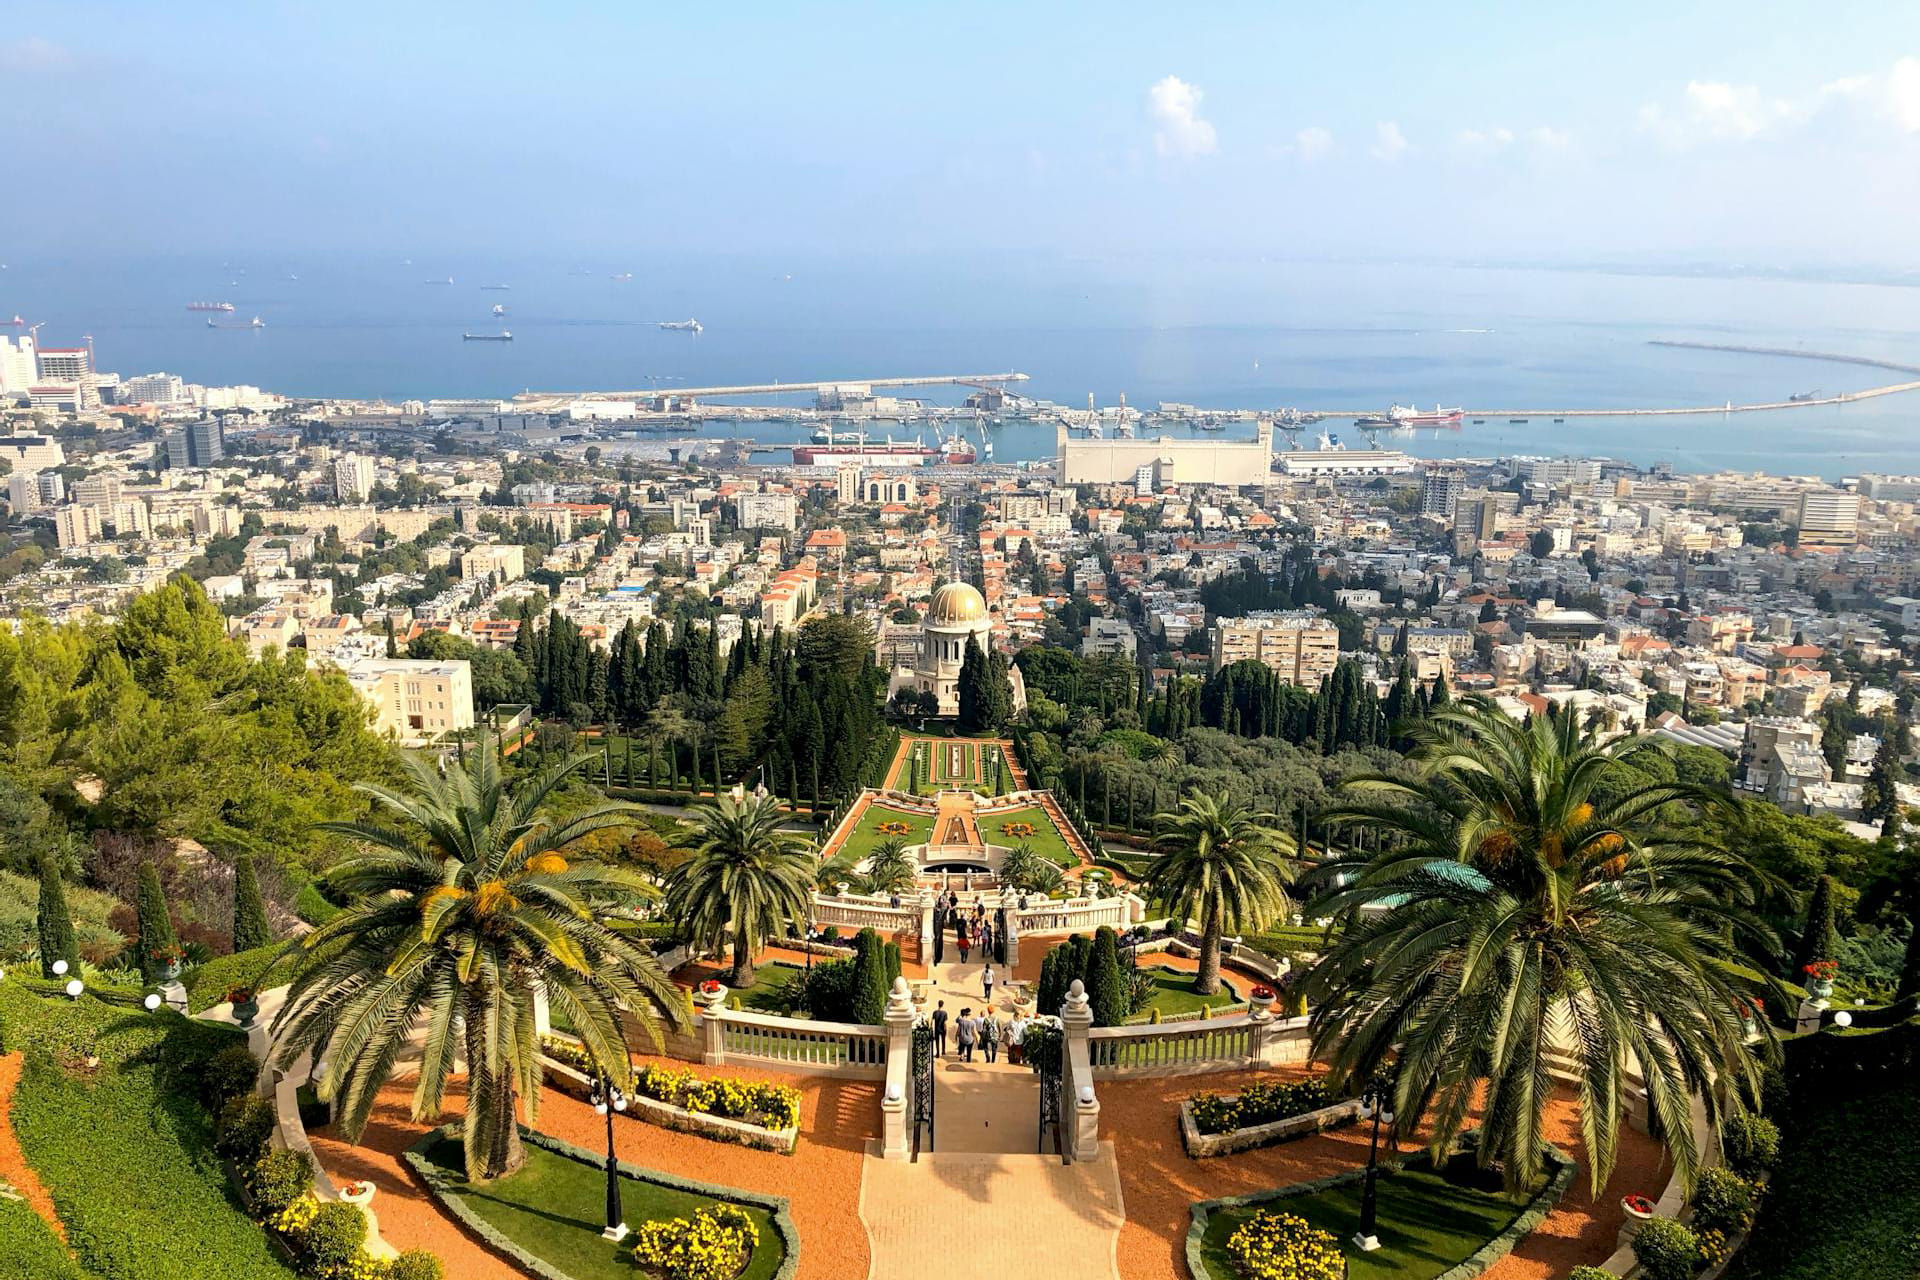
Jewish, Christian, and Muslim festivals create predictable peaks that dominate the annual curve. Jerusalem and Nazareth fill months in advance while Eilat and Netanya see milder lifts. Between festivals the national curve dips, yet certain niche markets such as archaeological tours or medical travel keep a base level of arrivals. Understanding the calendar lets operators open or close wings, hire seasonal staff, and set advance-purchase discounts that smooth revenue without erasing the natural spikes.
Weather adds a secondary rhythm. Cooler winter months attract northern-hemisphere visitors escaping cold; hot summer months favor coastal swimming and air-conditioned shopping. Pilgrimage sites still draw crowds in heat because spiritual motives outweigh comfort, yet leisure hotels on the Mediterranean lower rates to protect volume. The combined calendar of faith dates plus climate therefore sets the full shape of national demand.
Coastal Resorts Responding Differently Than Inland Shrines
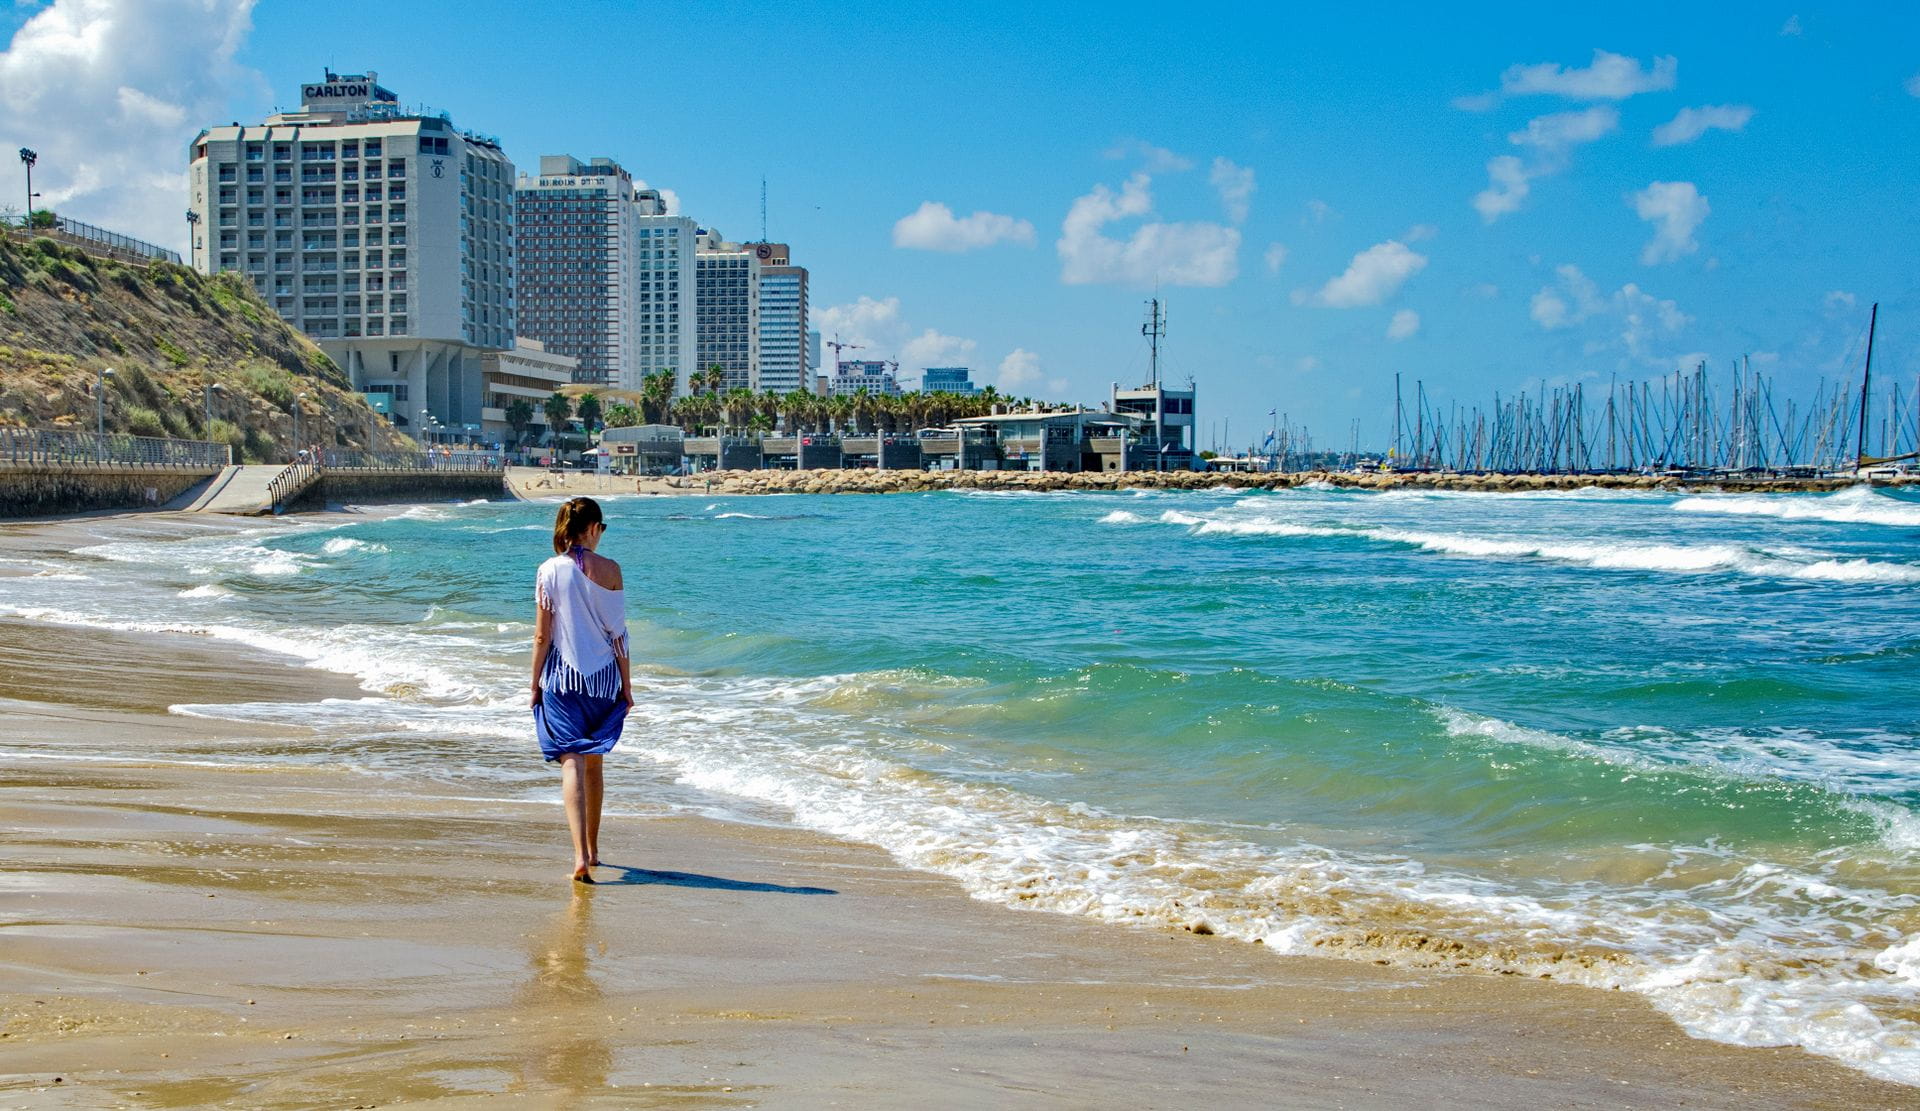
Beaches and spa towns sell relaxation and can raise rates only within leisure budgets. Inland holy cities sell meaning and can hold higher rates even when rooms feel basic. A five-star coastal property may empty when a rival destination cuts packages, while a modest guesthouse near a major shrine stays full. Demand curves therefore differ by location type. Coastal curves flatten earlier; inland curves remain steeper across a wider price range.
Transport links reinforce the split. Direct flights into Ben Gurion serve both markets, yet ground transfers to Jerusalem or the Galilee add cost and time that pure beach tourists often refuse. Operators who own assets in both zones can shift marketing spend toward the segment whose curve looks stronger in any given month. Readers monitoring public booking engines can notice coastal discounts appear sooner than Old City discounts whenever demand softens.
Data Sources Mapping Who Comes and When
Public statistics turn anecdotal stories into measurable curves. The Israel Central Bureau of Statistics releases monthly visitor arrival figures broken by country of residence and purpose of visit. Those tables let anyone separate pilgrimage-heavy months from leisure-heavy months. Currency and interest-rate statements from the Bank of Israel further show how shekel strength affects foreign purchasing power and therefore the price sensitivity of demand. Cross-country comparisons published by the OECD place Israeli trends against peer destinations so readers see whether local curves are unusually steep or typical. Macroeconomic context from the IMF Israel country analysis helps judge whether broader growth or slowdowns will lift or press the entire tourism sector. Construction and zoning data from the Israel Ministry of Construction and Housing reveal how new hotel supply may shift the supply side of the same market.
Anyone can download free tables and plot arrivals against average room rates published by hotel associations. The resulting scatter already sketches a demand curve without expensive software. Foundation regularly points readers toward these open sources so they can update their own pictures rather than wait for secondary summaries.
Housing Markets Feeling the Spill from Overnight Guests
Strong visitor nights raise short-term rental yields and encourage landlords to convert long-term apartments into tourist units. Neighborhoods near major shrines therefore experience tighter permanent housing supply and upward pressure on rents. Newcomers exploring aliyah or long-term relocation should examine how visitor surges interact with residential stock; the piece Housing Demand from New Aliyah Waves: A Beginner's Institutional Guide walks through the institutional numbers that connect immigration waves with overnight demand. Investors who follow capital gains changes also need the rules outlined in Updated Capital Gains Rules Every Foreign Investor Should Track because short-term rental profits fall under those provisions.
Jerusalem's hotel stock itself moves with visitor curves. Volatility patterns are explained in Hotel Occupancy Volatility in Jerusalem: A Journalist's Primer, while repositioning strategies appear in Hospitality Repositioning in Jerusalem: What New Readers Should Know. Broader market direction through 2026 is set out in Israel Real Estate Market 2026: The Outlook Serious Investors Need. Continuous coverage lives in the Israel Real Estate Market Trends archive.
Capital Flows Tied to Changing Visitor Preferences
When pilgrimage bookings stay firm while leisure softens, capital still flows into properties that serve faith groups. When both segments weaken, capital pauses and construction loans face higher scrutiny. Foreign investors watch these shifts because hotel and short-term rental assets respond faster to demand curves than ordinary residential stock. Foundation keeps practical answers in its FAQ (frequently asked questions) and longer discussions on the Blog so readers can match capital decisions to the latest arrival data.
Currency swings amplify the effect. A stronger shekel makes Israel more expensive for dollar or euro visitors and can flatten the demand curve overnight. A weaker shekel does the reverse. Tracking central-bank moves therefore becomes part of reading the curve itself.
Forward Outlook Drawn from Current Booking Trends
Advance booking windows lengthen when confidence is high and shorten when headlines create hesitation. Airlines and large tour operators publish load factors that already incorporate the latest curve. A rising share of far-out reservations for next year's festivals signals that the steep, low-elasticity pilgrimage segment remains intact. Rising last-minute bookings with heavy discounts signal that only the flexible leisure segment is active. Readers who check these public indicators every quarter can update their personal view of Israel's visitor demand without waiting for annual reports.
Supply additions also matter. New hotel rooms or short-term rental licenses shift the entire curve leftward if demand stays constant. Monitoring building permits and tourism-ministry licenses therefore completes the picture. Combining those supply figures with the arrival statistics already cited gives a balanced forecast rather than a one-sided demand story.
Related Foundation reading: Open Data APIs for Land Registries: Audit Trails and Compliance Record.
Timeless Value. Perpetual Legacy.